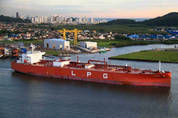
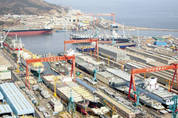
2013 was a record year for LPG ordering with 115 contracts signed, up 109% on 2012. So far this year, contracting has been firm with 49 LPG carriers ordered. This month’s Shipbuilding Focus takes a closer look at ordering trends in the LPG sector.As the Graph of the Month shows, there was a relatively firm level of LPG contracting during the ordering boom, 2005-08, with an average of 86 ships contracted p.a. The global recession saw ordering levels drop and just 25 LPG carriers were ordered in 2009. However, several large series orders contributed to an uptick in contracting in 2010 with 63 un
The consensus of opinion among analysts is that there is no end in sight to the current bleak period in the container liner sector. Tuan Hua Joo, executive partner, Alphaliner, has suggested that we are now in the equivalent of a “capacity arms race” triggered by Maersk’s order for 20 Triple-E vessels in 2011.Speaking recently at the TOC Container Supply China Conference in Singapore he elaborated: “Maersk miscalculated that it could push some of its competitors out of the way, but eventually it was forced to form the P3 alliance ? taking the step that indicated there was something wrong.“But,
Red ink is the most common feature of most liner operators’ results in 2013 and it looks like there is more pain on the way prompting, in turn, more asset sales with container terminal assets high on the list.CMA CGM and Maersk are the two notable exceptions in the liner operating sector that did turn in positive results in 2013 but, to a significant extent, CMA CGM’s results were due to the contribution made by the sale of 49% of its Terminal Link portfolio of terminals to China Merchants Holdings International (CMHI) for €400m.This gave CMHI equity positions in 15 terminals around the world

Ultramax bulkcarriers of around 60-65,000 dwt have become increasingly popular in recent years, largely replacing the slightly smaller Supramax design in contracting activity, offering a larger cargo capacity and greater fuel efficiency.In 2013, overall newbuilding interest in the bulker sector increased notably, and in total some 319 Ultramaxes were ordered. This was up 420% y-o-y, and accounted for almost one third of all bulker contracts placed globally.New Favourite For Chinese BuildersThe surge in demand for Ultramax newbuildings proved beneficial for Chinese yards, since almost 80% of Ul
Full-year 2013 numbers are in for the U.S. containerized ocean trade, and, as expected, year-over-year growth in imports, exports and total trade was middling. But what 2013 did more than anything else was set the stage for the real sea change that will come this year. Here’s what we learned about last year and how the landscape is changing.Q : How big are the carriers in the P3 Network in terms of overall U.S. trade?The P3 carriers ? Maersk Line, CMA CGM and Mediterranean Shipping Co. ? are the world’s three largest carriers in terms of fleet capacity, a scale reflected in the combined 26.9 p
Between the start of October 2008 and start of April 2013 the global orderbook declined 55% in CGT terms. Following this, the orderbook has grown 12% to 5,086 vessels of 108.0m CGT, as of 1st April 2014. This month’s Shipbuilding Focus looks at the size of the global orderbook and what this means for yards.What’s on the Book?As the line on the Graph of the Month shows, the orderbook grew strongly during the contracting boom. This was driven by buoyant ordering between 2005 and 2008, when an average of 65.6m CGT was contracted annually compared to 31.2m CGT between 2001 and 2004.The orderbook p
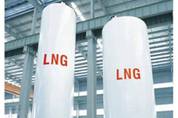
In a Lloyd’s Register report released this Monday, it has been suggested that LNG will account for 13 percent of the global bunker fuel market by 2020, increasing to 24 percent in 2025.During a media briefing in Singapore, Lloyd’s global marketing manager, Luis Benito announced the statistics gathered from an ‘LNG Bunkering Infrastructural Survey’ conducted earlier in the year.Out of the 50 ports surveyed around the world, 22 responded to a questionnaire organised to better understand the scope of how LNG will influence the maritime industry in the coming years. 15 ports were located in Europe
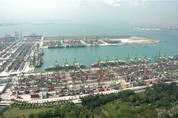
The rapid rise in container and dry bulk trade within Asia has provided strong support to global trade in the last decade. Of the 9.9bt of estimated world seaborne trade in 2013, more than 10% was intra-Asian trade of containers and key dry bulk commodities.Since 2003, world seaborne trade has risen by 50%, and the doubling of intra-Asian trade of containers and selected dry bulk commodities (as shown on the graph) has driven 20% of this growth.All Boxed UpIntra-Asian container trade volumes have been one of the fastest growing parts of global container trade, increasing on average by 9% p.a.
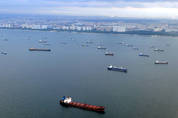
During January 2014, the number of vessels in the bulkcarrier fleet (above 10,000 dwt) reached 10,000. This has been a result of remarkable growth in the fleet, with particularly unprecedented expansion in the last few years.Pacing Out Fleet GrowthIt took approximately nineteen years for the number of vessels in the bulkcarrier fleet to double from 5,000 to 10,000 vessels. During the first fifteen years of this period, the fleet grew from 5,000 vessels to 7,500. While, as shown by the Graph of the Month, the expansion of the fleet from 7,500 vessels to 10,000 vessels (33% growth) was much more

Ocean container lines and the shipowners that lease ships to them are suspending new ship orders for fuel-efficient mega-container vessels until they can assess the impact of the expanding carrier alliances like the P3 Network, the expanded G6 and the CKYHE, and now the new merger between Hapag-Lloyd and CSAV.This temporary halt to new orders will not be enough to offset the record amount of new container ship deliveries this year, which will continue to put a lid on freight rates, according to a panel of shipowners and investors at the annual Invest in International Shipping Forum held by Cap


(주)미디어케이앤 서울특별시 서초구 법원로3길 19, 2층 2639호
Tel: 02)3411-3850 등록번호 : 서울, 다 06448, 등록일자 : 1981년 3월 9일, 발행인/편집인 : 국원경(010-9083-8708)
Copyrightⓒ 2014 미디어K& All Right Reserved.
UPDATE: 2026년 04월 13일 10시 32분